# Knitting Program Structure
* Option bars (bar + value)
* `x` = needle index
* `y` = time
The machine processes the lines from the bottom to the top, but only those enclosed between option lines (on the left and on the right).
The top of the program should have a delimitation line in red (instruction `1`) for the end of the program.
There's also a location of the needle written on the left of that line, but you can just forget about it as the default is to put the program to the right-most needle that allows it (indexing is from the left, yarn feeders start on the right).
## Directions
The first left and right option bars display the direction of the carrier (instead of `1` everywhere):
* `6`/`7` for going right/left (each line creates an odd number of passes)
* `1` for pure transfers with `R5=1` (knit cancel) - no direction change as this takes two passes
The carrier always starts on the left (thus going right).
The carrier should always end on the left (thus going left), but the last knitting pass with a yarn carrier should be going towards the right.
This means that typically, you want to do a set of empty passes (`R3=255`) at the beginning and at the end:
* at least 3 passes at the beginning (2 for clearing needles, one for getting to the right), and
* at least 3 passes at the end (2 for clearing needles, one for getting to the left).
Transfers typically happen after the knitting pass with two extra passes (so one line often ends up generating multiple passes of the carrier).
Lots of details, but fortunately you're provided with a class `DATFile` that encapsulates all of that in Javascript automatically.
You also don't have to write the directions, but you have to keep it in mind since it has a large impact on what your program means.
It can be generated automatically (or fixed) using `dat.setLineDirections()`, or before compilation on the machine.
## Yarn Feeder Position
Before compiling, the carrier start/end locations are inferred from yarn feeder positions.
This must be provided for each non-transfer line and is written as instruction `13`. No instruction can happen outside of the range of the two "feeder points" (the two carrier instructions representing start and end).
You don't have to write these though, as they can either be generated automatically (see examples below `dat.setCarrierPositions()`, or generated on the fly by the compiler on the machine.
# Writing Your Own Program
You will make use of Javascript to write DAT files.<br>
The details of that format have been [deciphered](https://github.com/textiles-lab/DAT-format) by the people in Jim McCann's [Textiles Lab](https://textiles-lab.github.io/) at CMU.<br >
As a summary, DAT files are [Run-Length-Encoded](https://en.wikipedia.org/wiki/Run-length_encoding) images.
Your main interface will be
* [datfile.js](images/datfile.js) for writing and reading DAT files
* [dat2png.js](images/dat2png.js) for visualizing DAT files
To use any of these, you need [Node.js](https://nodejs.org/en/).<br>
To install the visualization script dependencies, see [node-canvas](https://github.com/Automattic/node-canvas) (it's typically more than just `npm install canvas`).<br>
To install the conversion code, you need [png-js](https://github.com/devongovett/png.js).
**Note**: the visualization code was using version 1.6.11 of node-canvas.<br>
The new Canvas 2 API may / likely does not work.
The visualization script transforms a DAT file into a PNG image. Its usage is as follows:
```bash
./dat2png.js file.dat [file.png] [scale=1] [text=0]
```
Arguments:
* Input file (DAT)
* Output file (PNG), defaulting to DAT with extension replaced with `.png`
* Scale factor: for useful visualiztion, use a larger number, e.g. 10
* Text: boolean value for whether to display the instruction number in each cell (requires large scale to be readable)
Here are a few examples using `datfile.js`.
The corresponding images used `./dat2png.js file.dat file.png 10 1`.
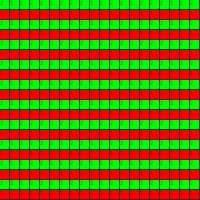
# Pattern1.js
* [pattern1.js](images/pattern1.js)
```js
const DATFile = require('./datfile.js');
let dat = new DATFile();
dat.allocatePixels(20, 20);
for(let x = 0; x < 20; ++x){
for(let y = 0; y < 20; ++y){
dat.setPixel(y, x, 1 + (y % 2));
}
}
dat.write('pattern1.dat');
```
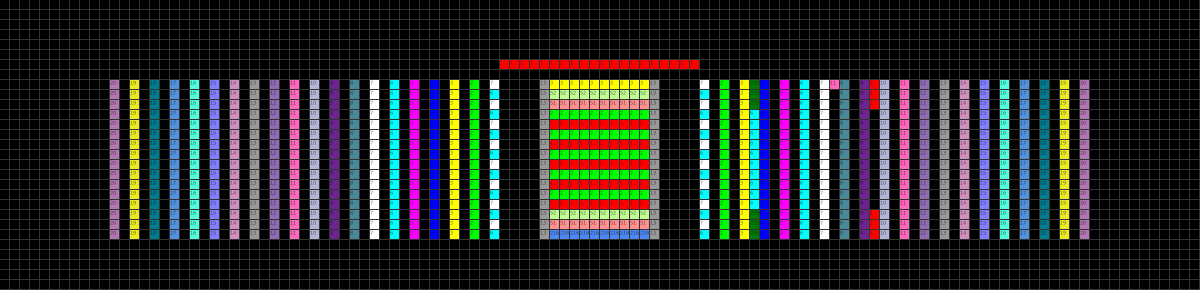
# Test1.js
* [test1.js](images/test1.js)
```js
const DATFile = require('./datfile.js');
let dat = new DATFile();
dat.allocateLines(10, 10, true);
for(let i = 0; i < 10; ++i){
dat.setLine(i + 3, 1 + (i%2), { R3: 6 }, i % 2 ? 'right' : 'left');
}
dat.setLineDirections();
dat.setCarrierPositions();
dat.write('test1.dat');
```

# Test2.js
* [test2.js](images/test2.js)
```js
const DATFile = require('./datfile.js');
let dat = new DATFile();
dat.create(10);
dat.writePreamble(); // newline=true (because streaming from create)
for(let i = 0; i < 10; ++i){
dat.setLine(dat.current, 1 + (i%2), { R3: 6 }, i % 2 ? 'right' : 'left', true);
}
dat.writePostamble();
dat.setLineDirections();
dat.setCarrierPositions();
dat.write('test2.dat');
```
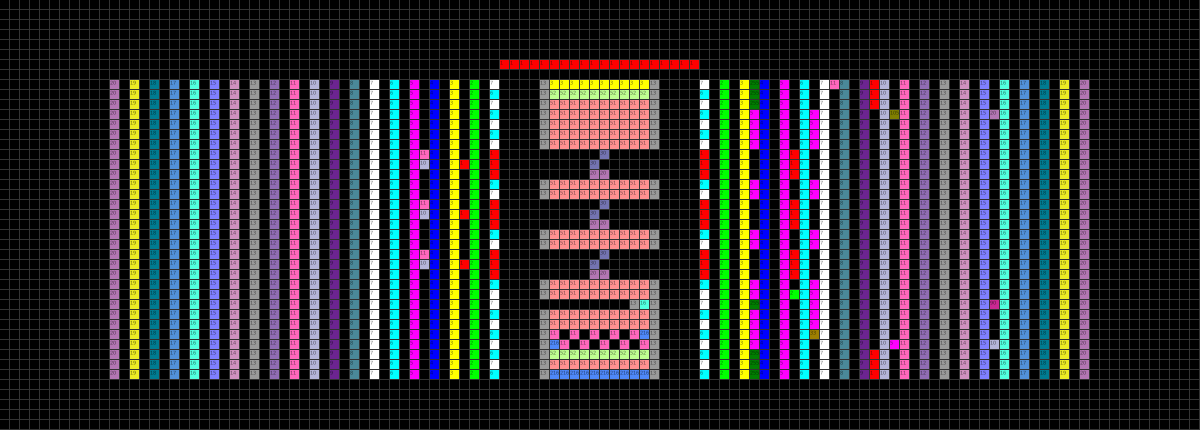
# Test3.js
* [test3.js](images/test3.js)
```js
const DATFile = require('./datfile.js');
let dat = new DATFile();
dat.create(10);
dat.writePreamble(); // newline=true (because streaming from create)
// create welt for hookup
for(let i = 1; i < 10; i += 2)
dat.setValue(dat.current, i, 11); // tuck
dat.setValue(dat.current, 0, 216); // float
dat.setLineOptions(dat.current, { R3: 5, R10: 5, R15: 10 });
dat.newLine();
for(let i = 0; i < 10; i+= 2)
dat.setValue(dat.current, i, 11); // tuck
dat.setValue(dat.current, 9, 216); // float
dat.setLineOptions(dat.current, { R3: 5, R6: 33 });
dat.newLine();
// knitting
for(let i = 0; i < 2; ++i)
dat.setLine(dat.current, 51, { R3: 5, R6: 5 });
// cutting
dat.setSegment(dat.current, 9, [16], { R3: 255, R6: 5, R15: 90 }); // R15=90 for end of yarn init
// knitting
for(let i = 0; i < 2; ++i)
dat.setLine(dat.current, 51, { R3: 5, R5: i == 0 ? 2 : 0, R6: 5 }); // reset carrier (R5) on first line
// transfer + knitting
for(let i = 0; i < 3; ++i){
// transfer
dat.setSegment(dat.current, 4, [20, 20], { R5: 1 });
dat.setSegment(dat.current, 4, [30], { L2: 1, L4: 10, R5: 1 });
dat.setSegment(dat.current, 5, [30], { L4: 11, R5: 1 });
// knit
dat.setLine(dat.current, 51, { R3: 5, R6: 5 });
dat.setLine(dat.current, 51, { R3: 5, R6: 5 });
}
// end knitting
dat.setLine(dat.current, 51, { R3: 5, R6: 5 });
dat.setLine(dat.current, 51, { R3: 5, R6: 5, R10: 105, R15: 20 });
dat.writePostamble();
dat.setLineDirections();
dat.setCarrierPositions();
dat.write('test3.dat');
```
# Drawing Your Own Program
You can also draw your program as PNG and then convert it to DAT.<br>
The required scripts for conversion are:
* [png2dat.js](images/png2dat.js) for translating PNG to DAT files
* [datfile.js](images/datfile.js) (library used by png2dat)
The script `png2dat.js` takes as input a png file, and and optional output dat target.
```bash
./png2dat.js file.png [file.dat]
```
For writing anything reasonable, make sure to work with the necessary colormap so the color numbers map directly to the instructions that are in the reference documents of the introduction.
You can download and modify the following 20x20 pattern (should be likely up-scaled):

# Miscellaneous Resources
[Accessibility](http://accessibility.mit.edu/) @ [MIT](http://web.mit.edu) [CSAIL](http://csail.mit.edu)